This is a pre-release beta of Predata Trends, a new platform to surface Predata insights on financial and geopolitical risk.
This product is under active development. The interface should be expected to change before release.
© 2018 Predata About Terms Privacy policy
Relative volatility overview
Predata relative volatility signals quantify public interest in online content, each signal reflecting a specific geopolitical or economic concern.
Predata combines machine learning and domain-expert analysis to identify and measure web traffic that implies clear information-seeking intent. Our focus on online research intensity, rather than frequency or sentiment of news and social media mentions, means media voices affect our signals only to the extent they affect public behavior.
Each signal captures recent trends in online interest towards its subject as a single number, normalized to a standard scale of 0 to 100:
Predata relative volatility signal example
- Research interest in U.S.-China trade disputes
From signals to market insight
Relative volatility signals incorporate anonymized traffic metadata from hundreds of thousands of online sources — covering a range of political, economic, and other professional interests.
Illustrative example: Top 10 elevated relative volatility signals (2018-08-23)
- Central Bank of Brazil: Yields
- Iran Deep State
- The Arctic
- South African Reserve Bank: Yields
- Hajj
- Generic 1st Soybean Future
- Silver
- OPEC
- EU Financial Regulation
- Generic 1st Copper Future
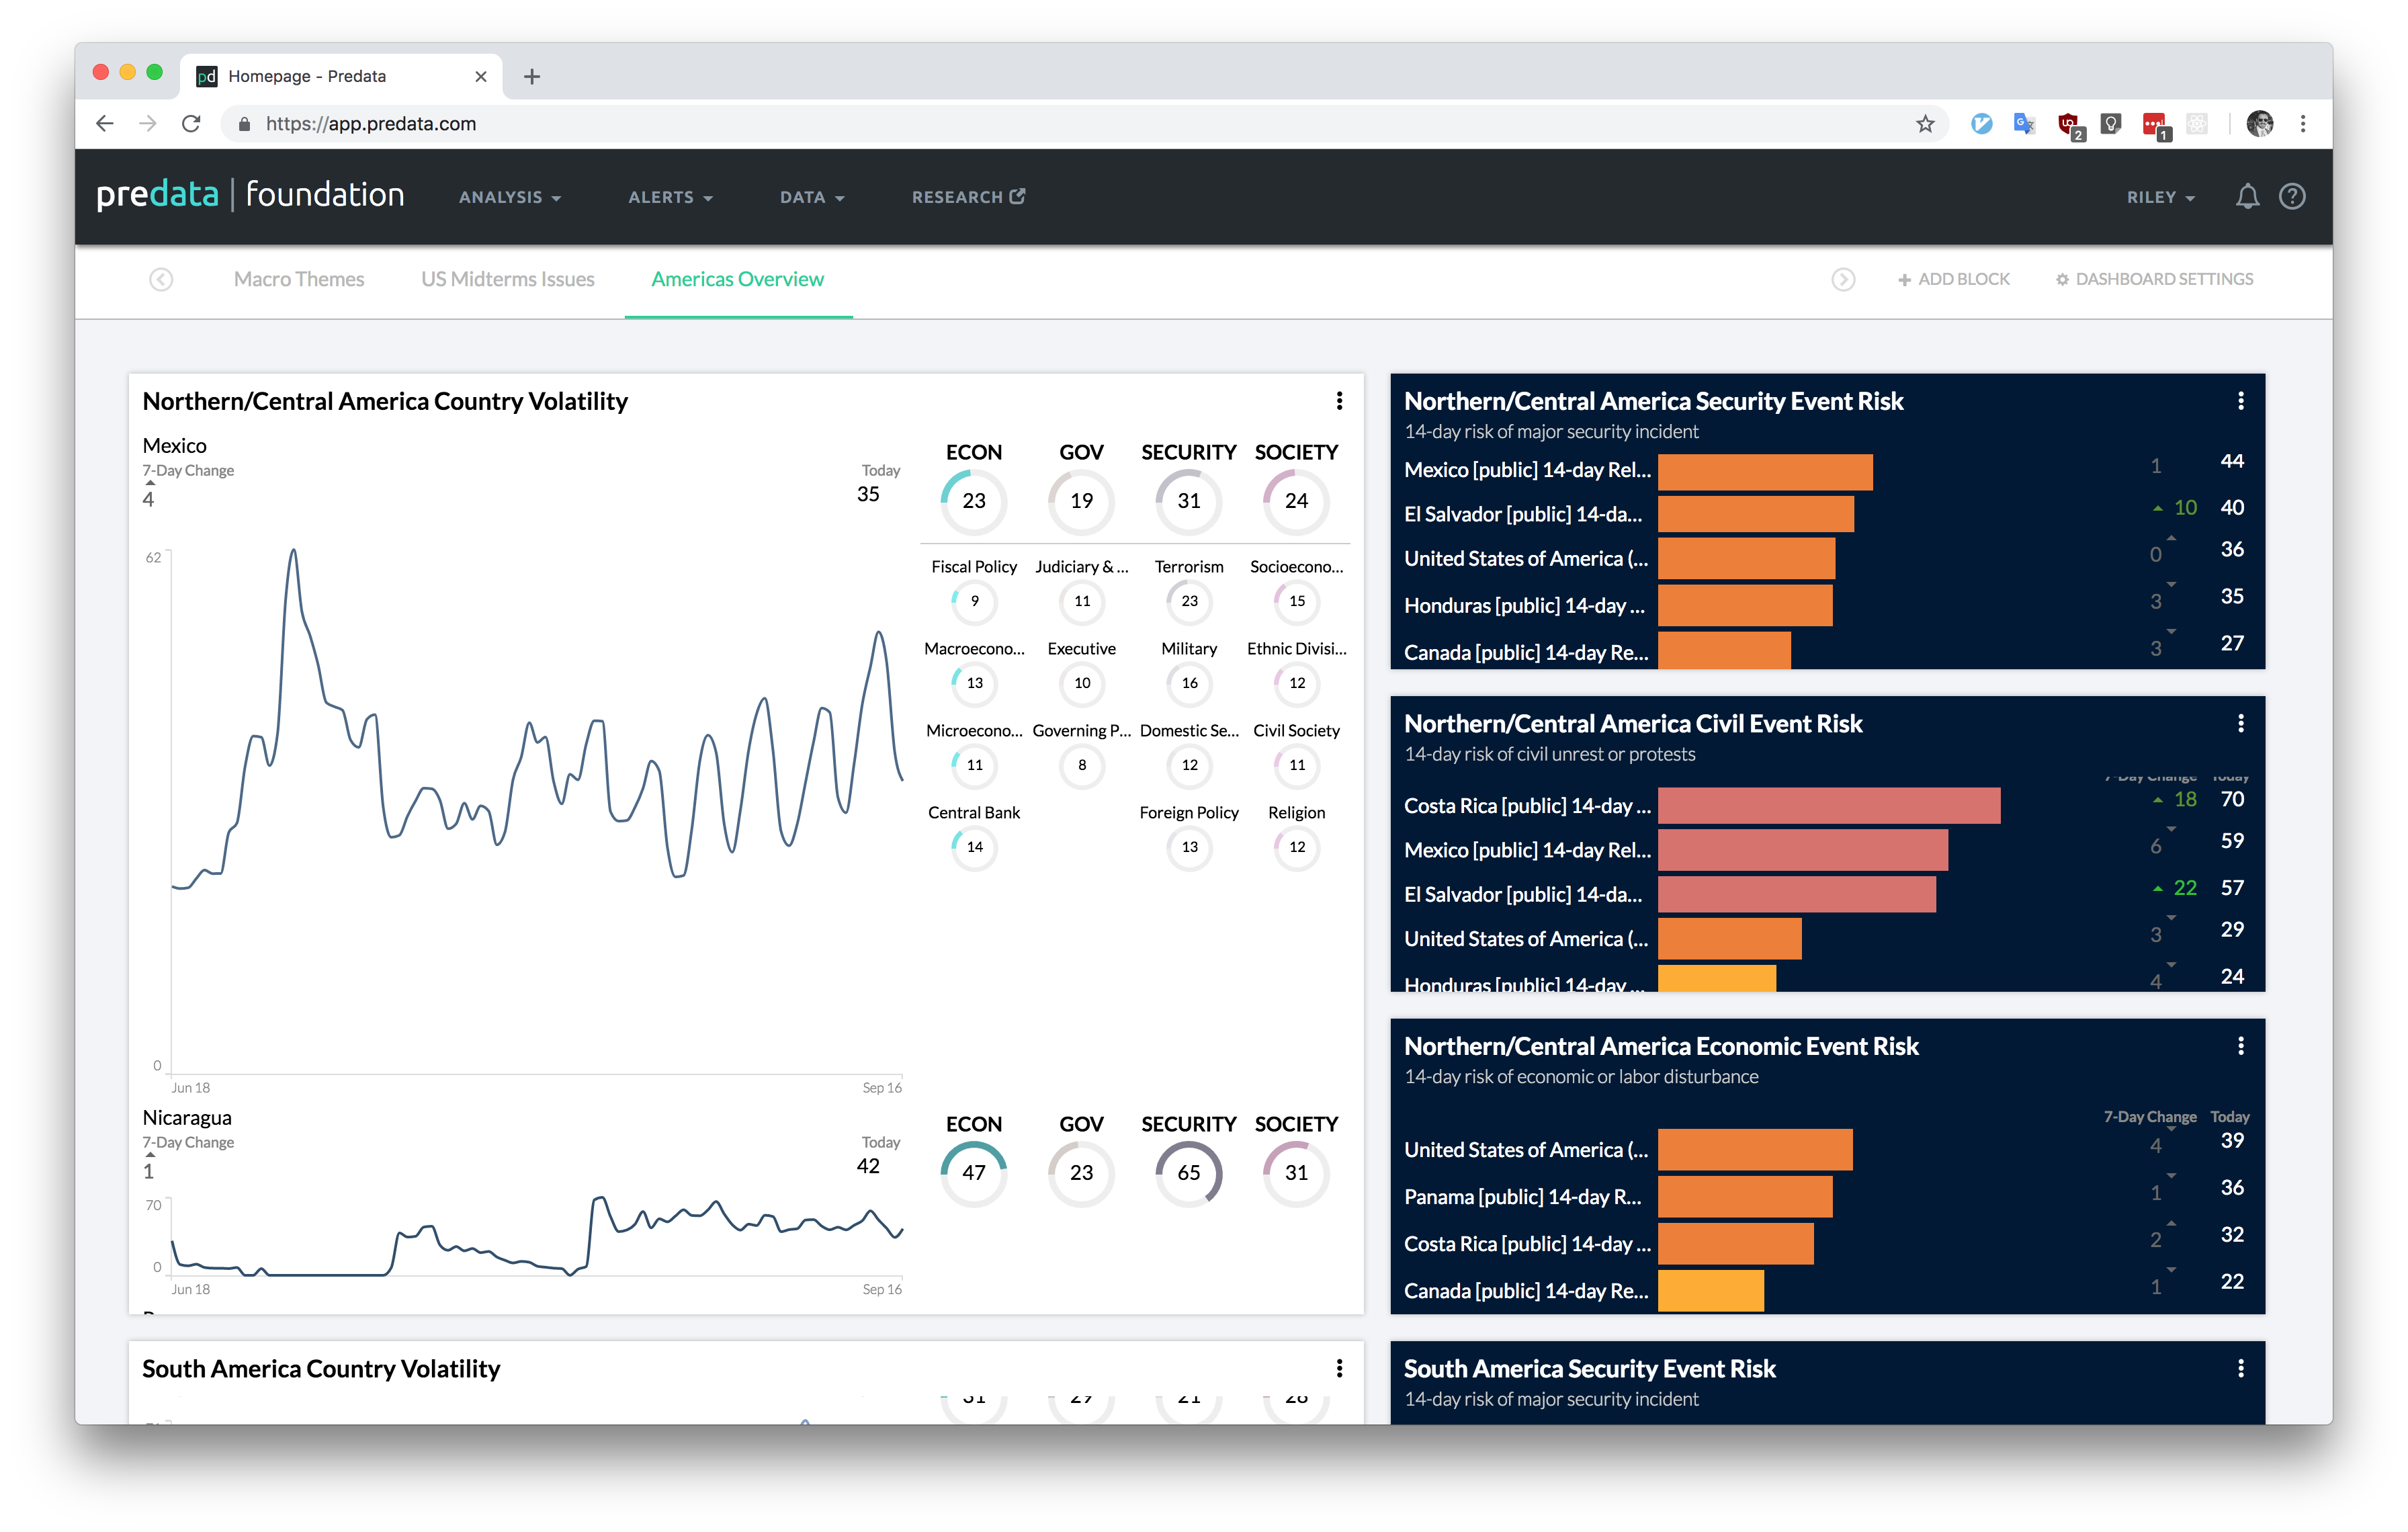
The Predata platform includes out-of-the-box global coverage of countries and regions around the world, with topics divided into Economic, Government, Security, and Society categories. Once you've selected Predata signals relevant to your business, you can use Predata dashboards to see at-a-glance insights and receive e-mail alerts of unusual activity:
You can build custom signals for particular market risks by combining selections of sources identified by Predata analysts. All indicators can be compared in the platform to returns on securities, commodities, or ETFs.
Case study: Facebook M&A online research interest
Predata quantifies millions of niche professional interests, yielding a window into the concerns of institutional traders and elite decision-makers.
In this case study, we consider research interest toward prior acquisitions of Facebook in July of 2018. Since the lay public is unlikely to research months-old technology M&A negotiations, an index of these subjects isolates institutional analysts, leaking metadata with implications about their investment strategies.
In particular, we find elevated signals for research into prior acquisition targets are likely leading indicators of Facebook price corrections.
Predata signal
- FB M&A interest
FAANG securities
(7-day return)
(7-day return)
- FB
- AAPL
- AMZN
- GOOG
Tech ETFs
(7-day return)
- VGT
- QQQ
- SOCL
- FTEC
- JHMT
Case study: 2018 Mexican election and USD/MXN
Preceding the 2018 Mexican general elections, elevated values in a diverse range of signals for corruption and security issues in Mexico anticipate later Mexico-related ETF movements.
Predata signals serve as effective barometers of concern around the world, giving numerical indices to issues otherwise difficult to quantify — such as elections in the absence of reliable independent polling.
Predata signal
- Corruption in Mexico
- Mexican Election 2018
- Jose Meade
- NAFTA
- Welfare in Mexico
- Security in Mexico
Mexico-related ETFs
(7-day return)
- EWW
- ILF
- FLMX